Field Notes
<--2017-08-09 10:40:00 | 2017-09-06 09:30:00-->Other sites visited today: Twitchell Alfalfa | Sherman Wetland | East End | Bouldin Corn
Phenocam link: Searching...
Bouldin Alfalfa: 2017-08-23 10:00:00 (DOY 235)
Author: Daphne Szutu
Others: Elke Eichelmann, Kyle Hemes
Summary: Regular data collection/cleaning, LAI, spectral, clip plots, veg height
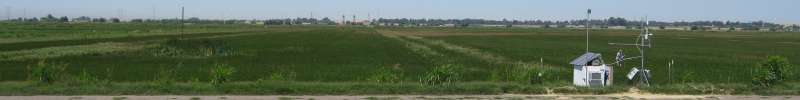
| 2017-08-23 Bouldin Alfalfa We arrived at 10:00. It was clear, sunny, and hazy near the horizon. The alfalfa is flowering and there are many yellow butterflies in the field. Elke collected met, camera, and Licor GHG data and cleaned the rad and EC sensors. LI7500 readings: CO2 364.87 umol/mol H2O 794.1 mmol/m3 T 22.75 C P 101.37 kPa SS 93.2 --> 99.5 after cleaning Kyle measured veg height and took biomass clip plots. Elke took spectral measurements - measurement 29 was accidentally took with cap on; discard the measurement. I took LAI measurements. I set up one wand on a tripod as the above/reference measurement, and used the other wand to take scattering data ("BA0823SC") and LAI data with 10 above and 10 below measurements("BA0823"). I computed the data on the console and LAI ~ 1.7. We left at 10:40. |
Next Mowing: 2017-08-25
Veg Height (cm): Tape measure from ground to top of plant
44, 50, 40, 36, 43, 31, 46, 39, 43, 44, 41, 36, 39, 33, 46, 33, 60, 33, 48, 49, avg = 41.7, stdev = 7.15
1 photos found

bouldinalfalfa_2017_08_23_091607.jpg ( 2017-08-23 08:25:42 ) Full size: 1296x960
fieldwork
7 sets found
5 BA_flux graphs found
21 BA_met graphs found
No data found for BA_arable.
Can't check TATWBABCSB_cam
Can't check MBSWEEWPBCBA
2 BA_processed graphs found
No data found for BA_adex.