Field Notes
<--2018-09-27 10:10:00 | 2018-10-17 11:30:00-->Other sites visited today: Vaira
Phenocam link: Searching...
Tonzi: 2018-10-12 10:30:00 (DOY 285)
Author: Joe Verfaillie
Others: Siyan
Summary: Standard fieldwork - all seems well
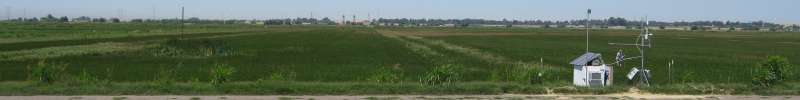
| Tonzi 2018-10-12 I arrived at about 10:30 with Siyan. It was a mild fall day with good visibility – Mt Diablo was just visible from the tower top. There was a little rain last week, but everything is pretty brown here. I collected the data and Siyan did the regular fieldwork. The Tower read: 412.1ppm CO2, 518.8mmol/m3 H2O, 98.8kPa, 19.5C, 98.8SS The Floor read: 408.7ppm CO2, 560.9mmol/m3 H2O, 99.0kPa, 20.7C, 99.3SS The FLIR camera was running but the computer was hung up with some strange error. There were only about two days of images. I restarted the computer and it seemed to be running properly. I used the Nikon range finder to get a few readings on points in the FOV but need a photo to annotate. Everything else seemed okay. The battery on the IRT seems to be dying. |
Field Data
No tank data
Well Depth
| Date | Location | Depth (feet) |
|---|---|---|
| 2018-10-12 | TZ_floor | 28 |
| 2018-10-12 | TZ_tower | 32.6 |
| 2018-10-12 | TZ_road | 36.7 |
mode = both
Moisture Point Probes TZ
Array
(
[0] => Tower_1
[1] => Floor_South_1
[2] => Floor_West_1
[3] => Soil_Transect_4_1
[4] => Soil_Transect_3_1
[5] => Soil_Transect_2_1
[6] => Soil_Transect_1_1
[7] => SoilCO2_West_A_1
[8] => SoilCO2_West_B_1
[9] => SoilCO2_West_C_1
[10] => Tower_2
[11] => Floor_South_2
[12] => Floor_West_2
[13] => Soil_Transect_4_2
[14] => Soil_Transect_3_2
[15] => Soil_Transect_2_2
[16] => Soil_Transect_1_2
[17] => SoilCO2_West_A_2
[18] => SoilCO2_West_B_2
[19] => SoilCO2_West_C_2
[20] => Tower_3
[21] => Floor_South_3
[22] => Floor_West_3
[23] => Soil_Transect_4_3
[24] => Soil_Transect_3_3
[25] => Soil_Transect_2_3
[26] => Soil_Transect_1_3
[27] => SoilCO2_West_A_3
[28] => SoilCO2_West_B_3
[29] => SoilCO2_West_C_3
[30] => Tower_4
[31] => Floor_South_4
[32] => Floor_West_4
[33] => Soil_Transect_4_4
[34] => Soil_Transect_3_4
[35] => Soil_Transect_2_4
[36] => Soil_Transect_1_4
[37] => SoilCO2_West_A_4
[38] => SoilCO2_West_B_4
[39] => SoilCO2_West_C_4
)
| Date | DOY | Rep | Depth | Tower_1 |
Floor_South_1 |
Floor_West_1 |
Soil_Transect_4_1 |
Soil_Transect_3_1 |
Soil_Transect_2_1 |
Soil_Transect_1_1 |
SoilCO2_West_A_1 |
SoilCO2_West_B_1 |
SoilCO2_West_C_1 |
Tower_2 |
Floor_South_2 |
Floor_West_2 |
Soil_Transect_4_2 |
Soil_Transect_3_2 |
Soil_Transect_2_2 |
Soil_Transect_1_2 |
SoilCO2_West_A_2 |
SoilCO2_West_B_2 |
SoilCO2_West_C_2 |
Tower_3 |
Floor_South_3 |
Floor_West_3 |
Soil_Transect_4_3 |
Soil_Transect_3_3 |
Soil_Transect_2_3 |
Soil_Transect_1_3 |
SoilCO2_West_A_3 |
SoilCO2_West_B_3 |
SoilCO2_West_C_3 |
Tower_4 |
Floor_South_4 |
Floor_West_4 |
Soil_Transect_4_4 |
Soil_Transect_3_4 |
Soil_Transect_2_4 |
Soil_Transect_1_4 |
SoilCO2_West_A_4 |
SoilCO2_West_B_4 |
SoilCO2_West_C_4 |
Avg | Spacial Count |
Measurement Count |
|---|---|---|---|---|---|---|---|---|---|---|---|---|---|---|---|---|---|---|---|---|---|---|---|---|---|---|---|---|---|---|---|---|---|---|---|---|---|---|---|---|---|---|---|---|---|---|
| 2018-10-12 | 285 | 0 | nan | 6.5 | 1 | 8.3 | 5.9 | 6.2 | 6.2 | 0.3 | 9.4 | 8.8 | 0.3 | 10.3 | 4.2 | 8.1 | 8.1 | 12.7 | 10.6 | 4.5 | 7.5 | 0.9 | 10.9 | 13.1 | 5.3 | 17.6 | 9.5 | 11.7 | 15.6 | 13.4 | 15.9 | 14.3 | 11.7 | 13.2 | 8.7 | 23.4 | 10.7 | 19.9 | 24.5 | 11.9 | 15.3 | 15.9 | 21.9 | |||
| 2018-10-12 | 285 | 1 | nan | 6.2 | 0.9 | 8.6 | 5.9 | 6.5 | 5.9 | 0.1 | 9.1 | 8.8 | 1.2 | 10.9 | 4.8 | 7.5 | 7.5 | 13.3 | 10.9 | 4.2 | 7.8 | 1.5 | 11.2 | 12.9 | 5.9 | 12 | 9.8 | 11.7 | 16.2 | 13.1 | 16.8 | 14.5 | 11.7 | 8.7 | 21.6 | 11 | 18.5 | 24.5 | 11.6 | 14.8 | 15.6 | 21.6 | ||||
| 2018-10-12 | 285 | Avg | 0-15cm | 0 | 0 | |||||||||||||||||||||||||||||||||||||||||
| 2018-10-12 | 285 | Avg | 15-30cm | 0 | 0 | |||||||||||||||||||||||||||||||||||||||||
| 2018-10-12 | 285 | Avg | 30-45cm | 0 | 0 | |||||||||||||||||||||||||||||||||||||||||
| 2018-10-12 | 285 | Avg | 45-60cm | 0 | 0 |
mode = both
Moisture Point Probes VR
Array
(
[0] => Flux_Tower_1
[1] => Gate_1
[2] => Biomass_Cage_1
[3] => Solar_Panels_2
[4] => Flux_Tower_2
[5] => Gate_2
[6] => Biomass_Cage_2
[7] => Solar_Panels_3
[8] => Flux_Tower_3
[9] => Gate_3
[10] => Biomass_Cage_3
[11] => Solar_Panels_4
[12] => Flux_Tower_4
[13] => Gate_4
[14] => Biomass_Cage_4
[15] => Solar_Panels_1
)
| Date | DOY | Rep | Depth | Flux_Tower_1 |
Gate_1 |
Biomass_Cage_1 |
Solar_Panels_2 |
Flux_Tower_2 |
Gate_2 |
Biomass_Cage_2 |
Solar_Panels_3 |
Flux_Tower_3 |
Gate_3 |
Biomass_Cage_3 |
Solar_Panels_4 |
Flux_Tower_4 |
Gate_4 |
Biomass_Cage_4 |
Solar_Panels_1 |
Avg | Spacial Count |
Measurement Count |
|---|---|---|---|---|---|---|---|---|---|---|---|---|---|---|---|---|---|---|---|---|---|---|
| 2018-10-12 | 285 | 0 | nan | 3.9 | 11.5 | 3.6 | 7.2 | 7.5 | 4.5 | 5.4 | 14.5 | 4.5 | 6.7 | 14.5 | 26.8 | 14.8 | 20.8 | 18.2 | ||||
| 2018-10-12 | 285 | 1 | nan | 2.7 | 10.9 | 3.6 | 7.2 | 7.2 | 4.5 | 5.1 | 13.4 | 5 | 7.3 | 15.9 | 26.5 | 14.5 | 20.5 | 18.5 | 2.1 | |||
| 2018-10-12 | 285 | Avg | 0-15cm | 0 | 0 | |||||||||||||||||
| 2018-10-12 | 285 | Avg | 15-30cm | 0 | 0 | |||||||||||||||||
| 2018-10-12 | 285 | Avg | 30-45cm | 0 | 0 | |||||||||||||||||
| 2018-10-12 | 285 | Avg | 45-60cm | 0 | 0 |
No TZ grass heigth found
No VR grass heigth found
Tree DBH
| Date | Tag# | Reading (mm) |
|---|---|---|
| 2018-10-12 | 1 | 7.8 |
| 2018-10-12 | 12 | 10.9 |
| 2018-10-12 | 2 | 5.2 |
| 2018-10-12 | 245 | 8.2 |
| 2018-10-12 | 3 | 7.2 |
| 2018-10-12 | 4 | 9.2 |
| 2018-10-12 | 5 | 7.6 |
| 2018-10-12 | 7 | 5.1 |
| 2018-10-12 | 72 | 15.9 |
| 2018-10-12 | 79 | 12.6 |
| 2018-10-12 | 8 | 5.9 |
No water potential data found
No TZ Grass Biomass data found
No TZ OakLeaves Biomass data found
No TZ PineNeedles Biomass data found
0 photos found
16 sets found
No data found for TZ_Fenergy.
11 TZ_tmet graphs found
11 TZ_soilco2 graphs found
Can't check TZ_mixed
3 TZ_mixed graphs found
1 TZ_fflux graphs found
8 TZ_fmet graphs found
No data found for TZ_tram.
3 TZ_co2prof graphs found
1 TZ_irt graphs found
No data found for TZ_windprof.
1 TZ_tflux graphs found
2 TZ_sm graphs found
Can't check TZ_met
1 TZ_met graphs found
Can't check TZVR_mixed
8 TZ_osu graphs found
No data found for TZ_fd.
Tonzi Z-cam data