Field Notes
<--2021-04-01 11:45:00 | 2021-05-04 15:10:00-->Other sites visited today: Tonzi | East End
Phenocam link: Searching...
Vaira: 2021-04-18 13:30:00 (DOY 108)
Author: Joe Verfaillie
Others: Koyko, Hisashi
Summary: Dry, high CO2 low H2O, went to the pond, lots of popcorn flowers, no cows.
| Vaira 2021-04-18 Koyko, Hisashi and I arrived at about 13:30 PDT. It was clear, sunny and hot with a breeze from the southwest. No rain for the last month. The grass is short, sparse and mostly going to seed. There are lots of pea flowers and huge patches of popcorn flowers. Hisashi and Kyoko did the soil moisture, well depth and grass height measurements. I collected the data. All seemed well – high CO2 and low H2O. The 7500 read: 415.6ppm, 216.2mmol/m3 H2O, 31.9C, 99.9kPa, 103.6SS I cleaned the radiometers – incoming LW was dirty, and did spectral measurements. We went to the pond. The roads are dusty dry but there was some water in the stream. No cows were to be seen. The pond level is below the top of the second staff gauge. We left at about 14:20 |
Veg Height (cm): Tape measure from ground to top of plant - Very patchy with open canopy of tall flowers and herbs
39, 14, 37, 46, 18, 9, 15, 24, 30, 42, 32, 36, 36, 23, 18, 16, avg = 27.2, stdev = 11.46
Field Data
No tank data
Well Depth
| Date | Location | Depth (feet) |
|---|---|---|
| 2021-04-18 | VR_pond | 17.82 |
| 2021-04-18 | TZ_floor | 30.4 |
| 2021-04-18 | TZ_road | 38.4 |
| 2021-04-18 | TZ_tower | 34.35 |
| 2021-04-18 | VR_well | 56.25 |
mode = both
Moisture Point Probes TZ
Array
(
[0] => Tower_1
[1] => Floor_South_1
[2] => Soil_Transect_4_1
[3] => Soil_Transect_3_1
[4] => Soil_Transect_2_1
[5] => Soil_Transect_1_1
[6] => SoilCO2_West_A_1
[7] => SoilCO2_West_B_1
[8] => SoilCO2_West_C_1
[9] => Tower_2
[10] => Floor_South_2
[11] => Soil_Transect_4_2
[12] => Soil_Transect_3_2
[13] => Soil_Transect_2_2
[14] => Soil_Transect_1_2
[15] => SoilCO2_West_A_2
[16] => SoilCO2_West_B_2
[17] => SoilCO2_West_C_2
[18] => Tower_3
[19] => Floor_South_3
[20] => Soil_Transect_4_3
[21] => Soil_Transect_3_3
[22] => Soil_Transect_2_3
[23] => Soil_Transect_1_3
[24] => SoilCO2_West_A_3
[25] => SoilCO2_West_C_3
[26] => Tower_4
[27] => Floor_South_4
[28] => Soil_Transect_4_4
[29] => Soil_Transect_3_4
[30] => Soil_Transect_2_4
[31] => Soil_Transect_1_4
[32] => SoilCO2_West_A_4
[33] => SoilCO2_West_B_4
[34] => SoilCO2_West_C_4
[35] => SoilCO2_West_B_3
)
| Date | DOY | Rep | Depth | Tower_1 |
Floor_South_1 |
Soil_Transect_4_1 |
Soil_Transect_3_1 |
Soil_Transect_2_1 |
Soil_Transect_1_1 |
SoilCO2_West_A_1 |
SoilCO2_West_B_1 |
SoilCO2_West_C_1 |
Tower_2 |
Floor_South_2 |
Soil_Transect_4_2 |
Soil_Transect_3_2 |
Soil_Transect_2_2 |
Soil_Transect_1_2 |
SoilCO2_West_A_2 |
SoilCO2_West_B_2 |
SoilCO2_West_C_2 |
Tower_3 |
Floor_South_3 |
Soil_Transect_4_3 |
Soil_Transect_3_3 |
Soil_Transect_2_3 |
Soil_Transect_1_3 |
SoilCO2_West_A_3 |
SoilCO2_West_C_3 |
Tower_4 |
Floor_South_4 |
Soil_Transect_4_4 |
Soil_Transect_3_4 |
Soil_Transect_2_4 |
Soil_Transect_1_4 |
SoilCO2_West_A_4 |
SoilCO2_West_B_4 |
SoilCO2_West_C_4 |
SoilCO2_West_B_3 |
Avg | Spacial Count |
Measurement Count |
|---|---|---|---|---|---|---|---|---|---|---|---|---|---|---|---|---|---|---|---|---|---|---|---|---|---|---|---|---|---|---|---|---|---|---|---|---|---|---|---|---|---|---|
| 2021-04-18 | 108 | 0 | nan | 13.8 | 3.3 | 7.4 | 11.2 | 11.1 | 5.3 | 14.7 | 9.4 | 4.2 | 20.3 | 15.8 | 14.2 | 19.7 | 22.5 | 9 | 21 | 6.9 | 17.9 | 23.7 | 26.8 | 17 | 22.6 | 26.2 | 25.4 | 27.6 | 26 | 39.4 | 40.3 | 23.1 | 36.5 | 46.6 | 23.1 | 41.4 | 42.3 | 44.3 | ||||
| 2021-04-18 | 108 | 1 | nan | 13.2 | 4.2 | 8.3 | 11.2 | 11.1 | 6.2 | 15 | 9.4 | 3.9 | 20.3 | 15.8 | 14.8 | 19.7 | 22.5 | 8.7 | 21.3 | 6.9 | 17.9 | 22.9 | 27.1 | 18.2 | 23.2 | 27.6 | 25.1 | 26.5 | 25.1 | 38.5 | 40.5 | 22.2 | 36.2 | 45.4 | 23.1 | 41.4 | 42.5 | 44.3 | 25.1 | |||
| 2021-04-18 | 108 | 2 | nan | 9.7 | 6.3 | 42 | 24.8 | |||||||||||||||||||||||||||||||||||
| 2021-04-18 | 108 | Avg | 0-15cm | 0 | 0 | |||||||||||||||||||||||||||||||||||||
| 2021-04-18 | 108 | Avg | 15-30cm | 0 | 0 | |||||||||||||||||||||||||||||||||||||
| 2021-04-18 | 108 | Avg | 30-45cm | 0 | 0 | |||||||||||||||||||||||||||||||||||||
| 2021-04-18 | 108 | Avg | 45-60cm | 0 | 0 |
mode = both
Moisture Point Probes VR
Array
(
[0] => Flux_Tower_1
[1] => Biomass_Cage_1
[2] => Flux_Tower_2
[3] => Biomass_Cage_2
[4] => Flux_Tower_3
[5] => Biomass_Cage_3
[6] => Flux_Tower_4
[7] => Biomass_Cage_4
)
| Date | DOY | Rep | Depth | Flux_Tower_1 |
Biomass_Cage_1 |
Flux_Tower_2 |
Biomass_Cage_2 |
Flux_Tower_3 |
Biomass_Cage_3 |
Flux_Tower_4 |
Biomass_Cage_4 |
Avg | Spacial Count |
Measurement Count |
|---|---|---|---|---|---|---|---|---|---|---|---|---|---|---|
| 2021-04-18 | 108 | 0 | nan | 3 | 1.5 | 13 | 7.8 | 7.8 | 16.2 | 17 | 18.5 | |||
| 2021-04-18 | 108 | 1 | nan | 2.7 | 1.8 | 13.3 | 8.1 | 7.6 | 16.5 | 17 | 19.1 | |||
| 2021-04-18 | 108 | Avg | 0-15cm | 0 | 0 | |||||||||
| 2021-04-18 | 108 | Avg | 15-30cm | 0 | 0 | |||||||||
| 2021-04-18 | 108 | Avg | 30-45cm | 0 | 0 | |||||||||
| 2021-04-18 | 108 | Avg | 45-60cm | 0 | 0 |
No TZ grass heigth found
No VR grass heigth found
No VR Tree DBH found
No water potential data found
No VR Grass Biomass data found
No VR OakLeaves Biomass data found
No VR PineNeedles Biomass data found
2 photos found
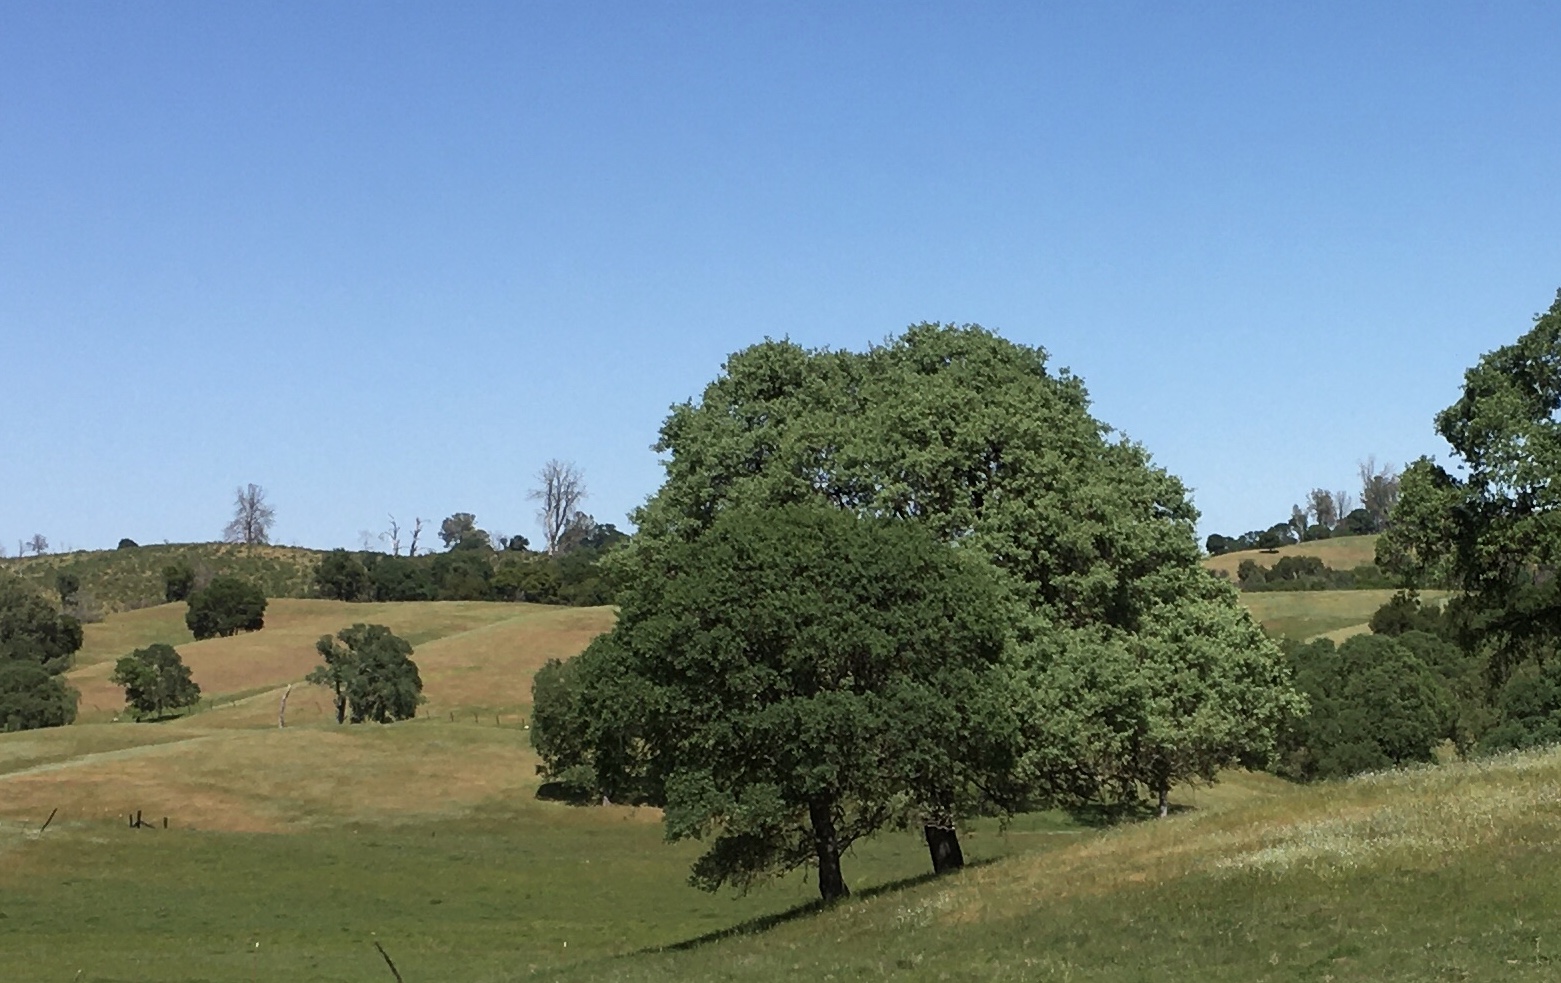
20210418VR_TreesGrass.jpg ( 2021-04-18 00:00:00 ) Full size: 1561x983
Different shades of trees and grass
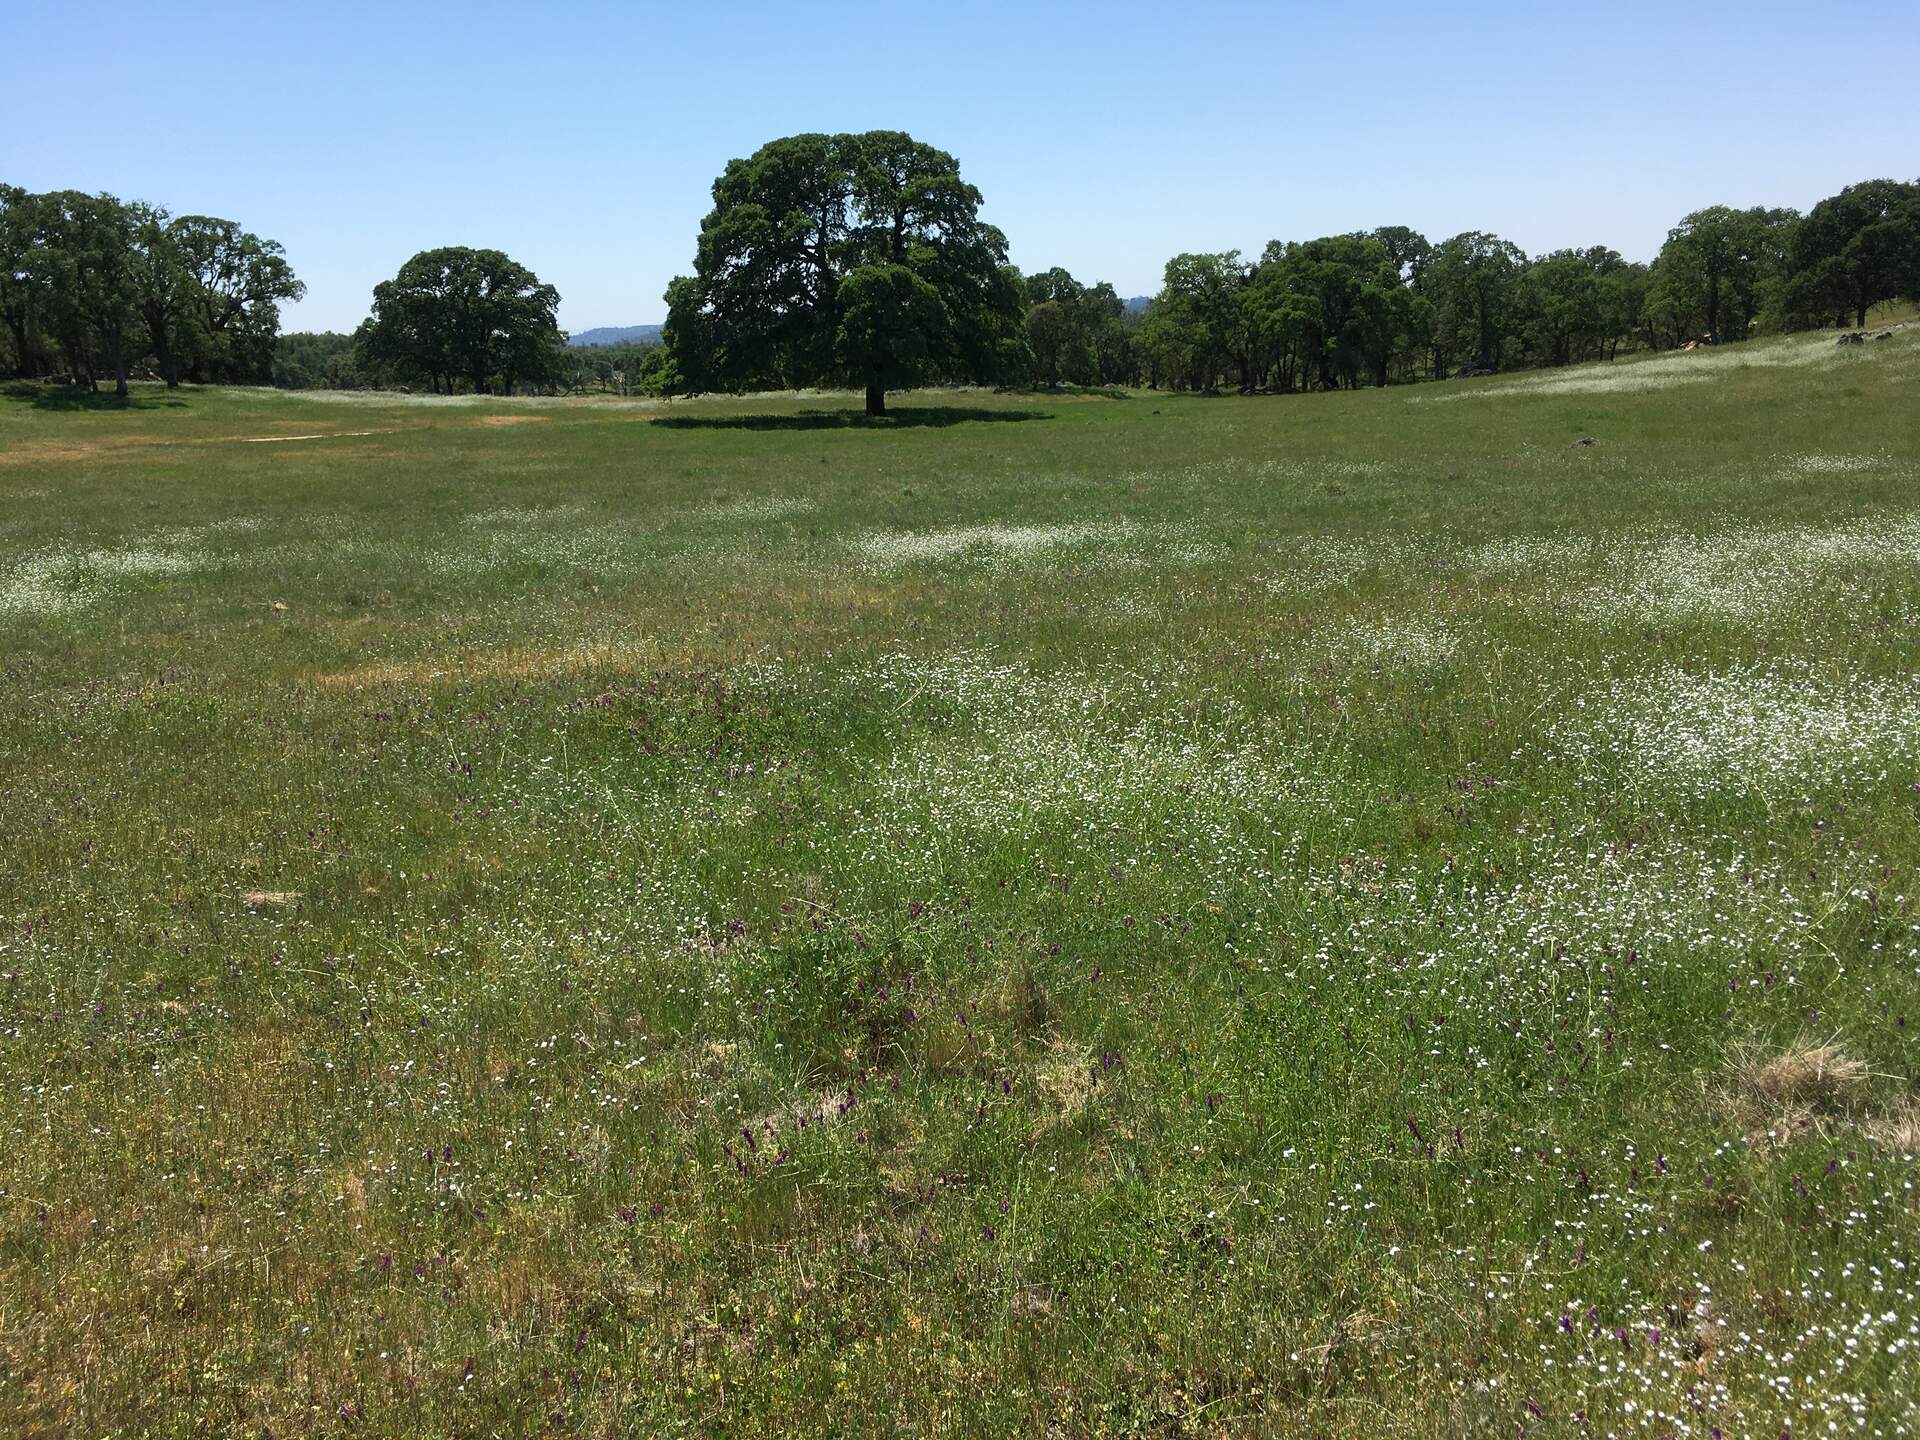
20210418VR_Flowers.jpg ( 2021-04-18 00:00:00 ) Full size: 1920x1440
Popcorn and pea flowers
9 sets found
16 VR_met graphs found
2 VR_flux graphs found
2 VR_soilco2 graphs found
2 VR_pond graphs found
Can't check TZVR_mixed
3 VR_fd graphs found
4 VR_processed graphs found
4 VR_arable graphs found
No data found for VR_soilvue.