Field Notes
<--2025-04-17 15:20:00 | 2025-05-22 14:32:00-->Other sites visited today: Mayberry | East End | Bouldin Corn
Phenocam link: Searching...
Gilbert Tract: 2025-05-09 08:30:00 (DOY 129)
Author: Joe Verfaillie
Others:
Summary: EXO not talking but maybe running, miniCH4 quit recording again, water samples failed, reinstalled HYDROS21, removed Campbell salinity - chewed, miniCH4 spot measurement, 7500 swapped
| Gilbert Tract 2025-05-09 I arrived at about 9:30 PDT. It was low-low tide at about 10:30 and my plan was to work at the channel to get water samples first and then work at the tower. There were some workers in the native plants wearing plastic jump suits probably to protect against ticks. I found two ticks on my pants legs soon after I arrived and another one later in the day. It was warm, sunny and almost no breeze. There's a pile of Azolla and other debris south of the solar panels that Kuno et al removed on 5/08. At the channel I could see the water sensors under water at the end of the track. There were a bunch of weeds to either side but not so much were the sensors are. I started to take the new regiment of water samples and discovered I was missing an extra syringe and needle. I had printed instruction but they were double sided and I soon got the sheets out of order. I managed to get the head space gas sample I think but it was nowhere near smooth. Then I tried to get the current readings from the EXO to go with the water samples and could not communicate with the EXO. At this point I was totally derailed and gave up on the water samples. Improvements for next time: Instructions for each sample on its own page and clearly label and ordered. Pack the equipment for each sample in its own box/bag labeled are ordered. I raked weeds out on either side of the track now that I didn't need clean water for the water samples. I was able to get some EXO data off the CR6 but it was full of NAN after 4/27. The miniCH4 only had a little data too but was still responsive and had good readings when I restarted it. The ADCP seemed to have a full set of data and looked to be good quality. I decided to pull up the sensors and bring the EXO in for testing. But when I got it out of the water the wiper was working but had some algae wrapped in it. Hard to say if the algae was there before I pulled it up or got caught there on the way up. I cleaned off the algae and decided to leave the EXO as is hoping it is storing data internally. I can use the one in the lab to test the Bluetooth communication and bring the other com adapter next time. I also set the miniCH4 to start timed measurements again. I arrived at the tower around 10:40 PDT. It was definitely hot now. Looks like the Azolla is already making a comeback. Here I did the standard maintenance collecting met, flux, camera and bird song data. The song meter said its batteries were still at 85% but back in the lab I only had recordings up to 4/22. I swapped the 7500 for calibration: sn 75h-2180 came off and sn 75H-2514 went on. I also change the 7700 heater settings to summer hours 20:00 to 06:00 instead of 18:00 to 08:00. 2180 dirty read: 428.2ppm CO2, 643.3mmol/m3 H2O, 24.1C, 101.7kPa, 95.5SS 2180 clean read: 443.9ppm CO2, 480.1mmol/m3 H2O, 99.7SS 2514 fresh read: 445.3ppm CO2, 552.7mmol/m3 H2O, 24.5C, 101.7kPa, 98.5SS The 7700 read: 2.14ppm CH4, 37.5RSSI - 77.9 after cleaning I uploaded the new config, set the pressure coefficients and restarted the box. The wash reservoir was about a third low. The todo list said to test the spray so I did – it seemed okay. There was only a few centimeters of clear water in the pond at the end of the boardwalk. Without the usual carpet of Azolla I could see small crayfish and other critters running along the bottom. The staff gauge read 27cm at 09:47 PST. I brought the last fresh miniCH4 sensor set to record continuously on power up. I put it in the water and powered it from a lithium power pack while I was at the site. I also brought the HYDROS21 sn H21G00003238 I removed weeks ago due to bad readings. It seems the bad readings were cause by the chewed extension cable between the tower and the junction box. This time I discovered that the cable to the Campbell conductivity probe had been cleanly snipped. I removed the probe sn 5688 (this one has a bad temperature sensor already). I wired up the HYDROS21 and it seemed to be giving good data. There was about 40cm of soft muck on the bottom of the pond. I scraped this away from the last post on the boardwalk and mount the HYDROS against the post. Hopefully it doesn’t get chewed. I plan to install a screened and filtered double walled well pipe here to better protect the water sensors. Conductivity Surface, 340uS, 22.2C Back in the lab I discovered that the Stardot clock was offset. Probably lost power when the data logger did due the the chewed cables. I left around 12:00 PDT. |
3 photos found

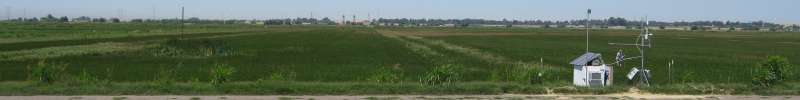
20250509GT_AzollaRecovery.jpg ( 2025-05-09 10:47:37 ) Full size: 1920x1440
Sonic water level sensor, end of the boardwalk and sparse Azolla.
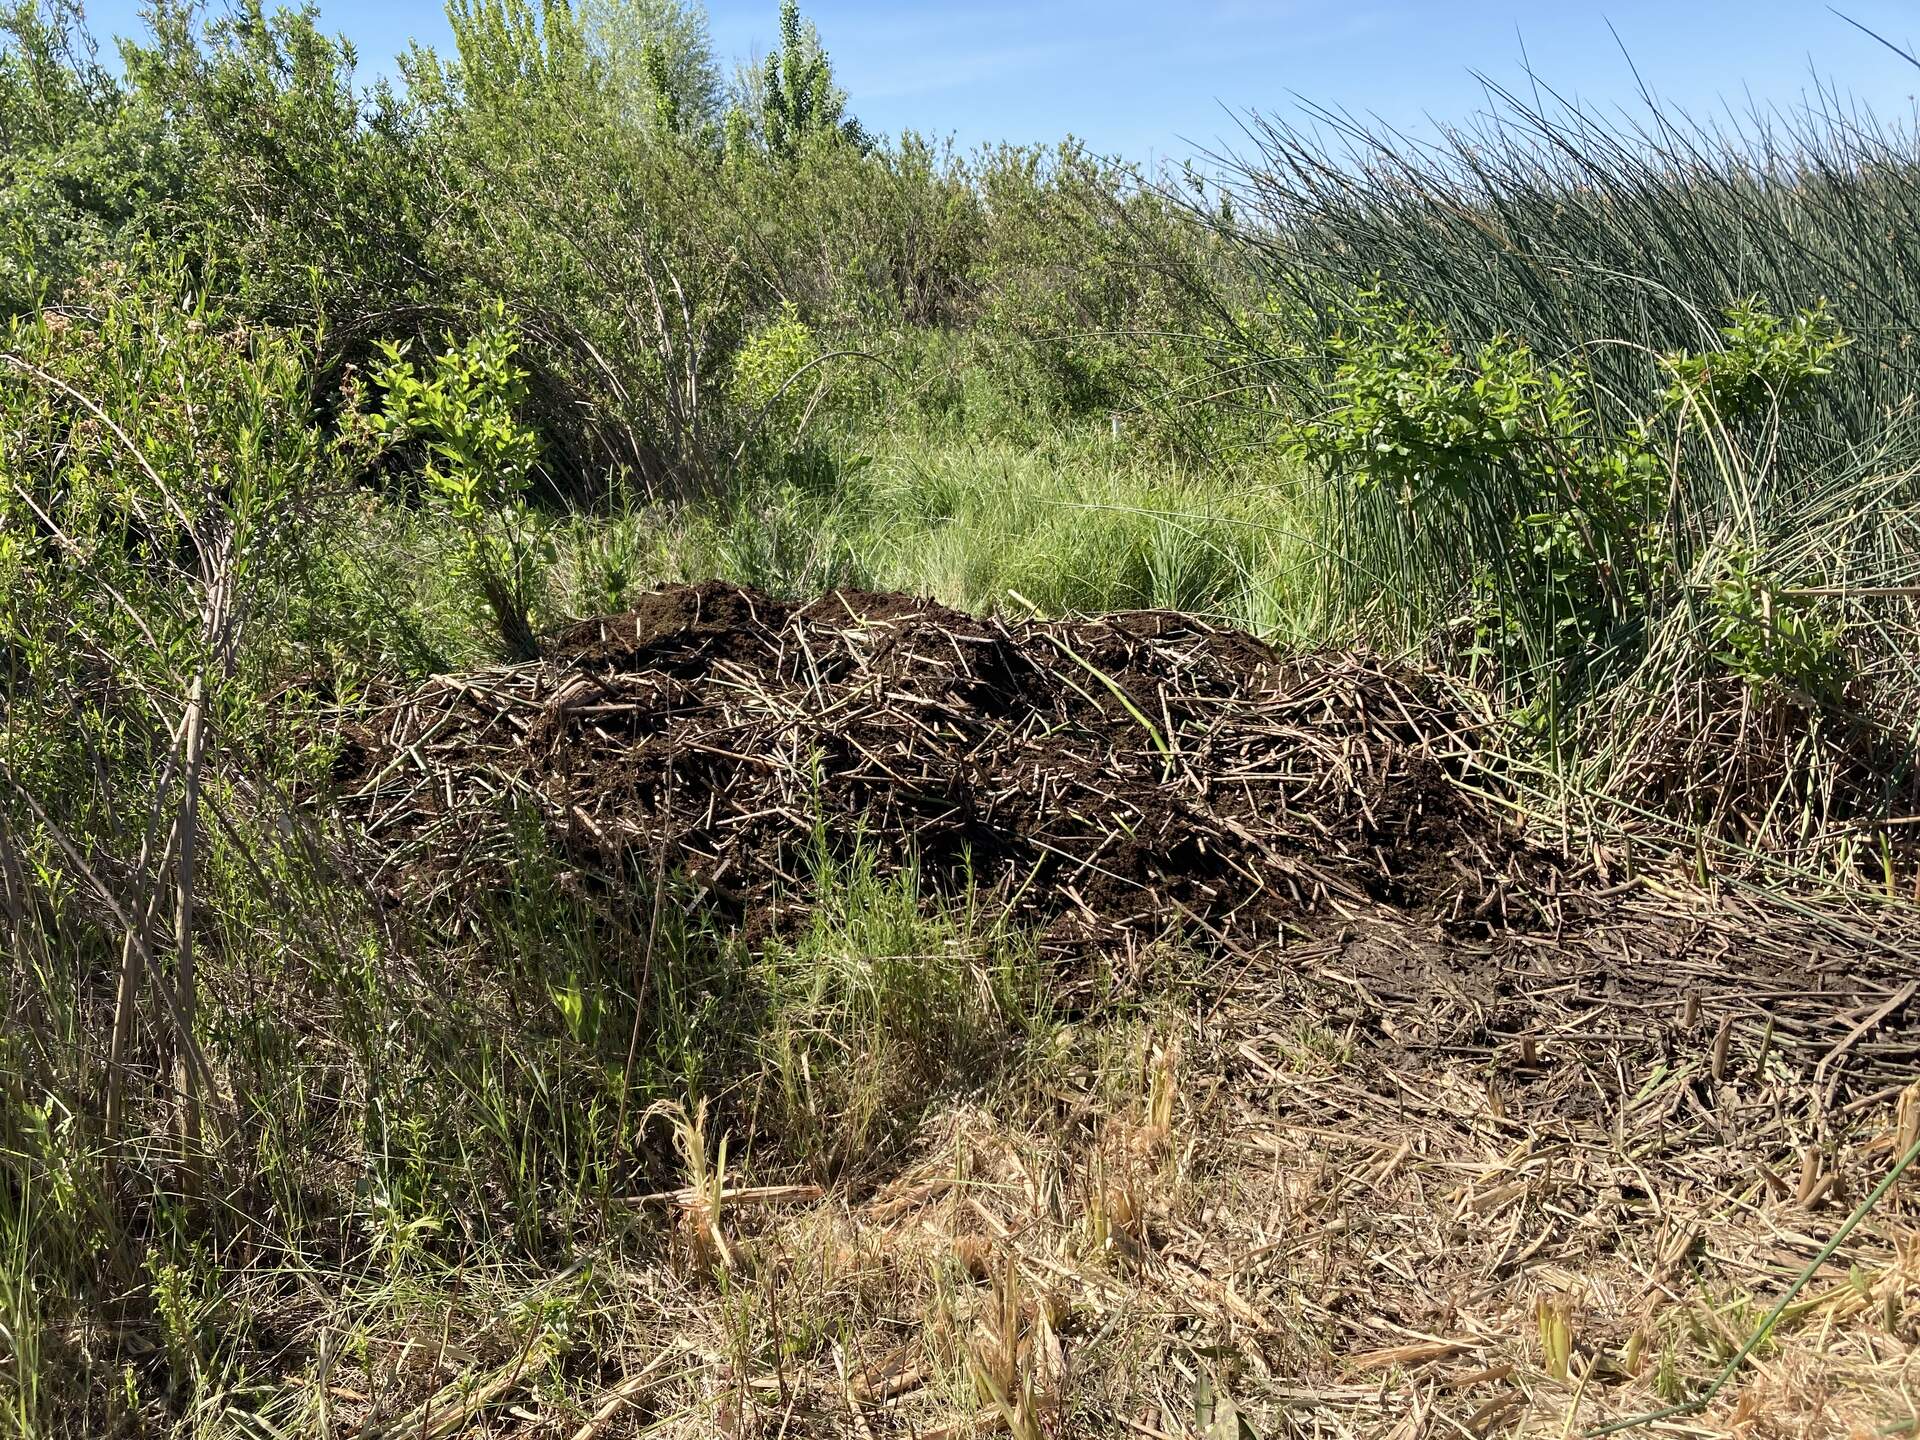
20250509GT_HarvestedAzolla.jpg ( 2025-05-09 10:40:04 ) Full size: 1920x1440
A pile of Azolla and other debris removed from the pond
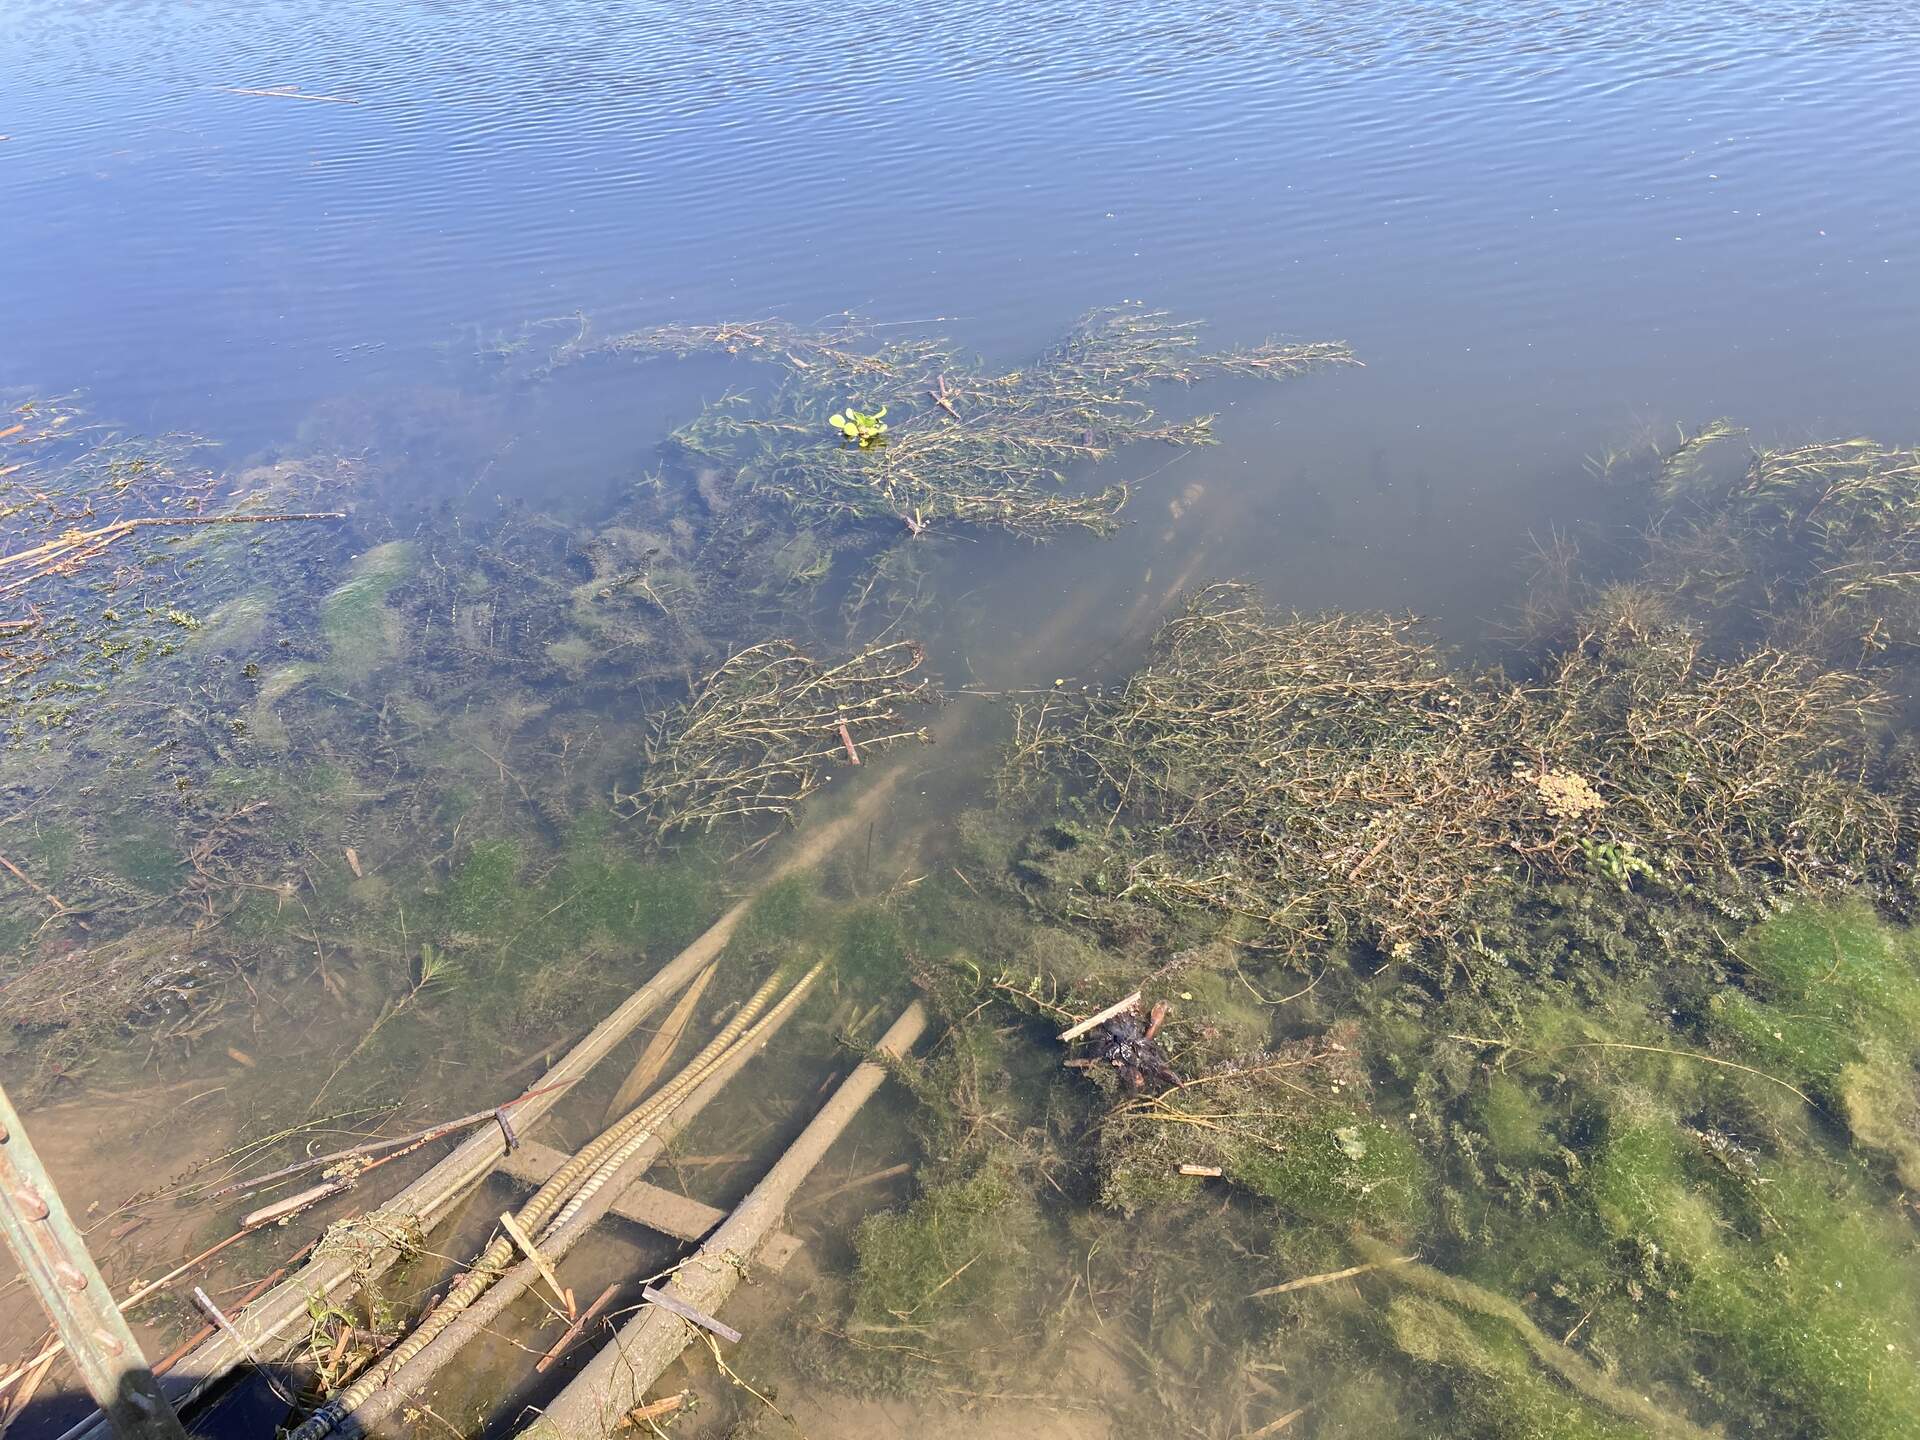
20250509GT_ChannelSensors.jpg ( 2025-05-09 10:10:42 ) Full size: 1920x1440
Channel water sensors visible at low tide
8 sets found
Can't check MBWPEESWGT_mixed
Can't check MBEEWPSWEPGT_cam
16 GT_met graphs found
4 GT_flux graphs found
3 GT_adcp graphs found
1 GT_cam graphs found
2 GT_usgs graphs found
2 GT_chanexo graphs found