Field Notes

<--2025-07-09 11:45:00 |
Phenocam link: Searching...

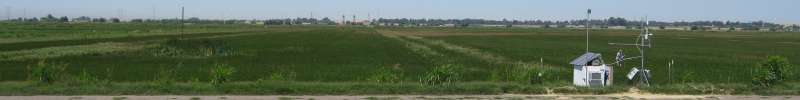
Gilbert Tract: 2025-07-11 12:00:00 (DOY 192)
Author: Inbar Amitay
Others: Eduardo Gamez Jr, Adan Barrera, Brandon Broach, Charlie Westly

Summary: No data download; 2 sets of DIC/DOC/headspace/TA samples about 25 min apart at lateral flux station

Approx 90F, sunny, slight breeze, no clouds. Tide flowing to the right if facing channel from LF station.

Took 2 sets of samples using van dorn in front of LF station approx 1/2 foot under water surface: 2x dissolved inorganic carbon (250ml beer bottle preserved with 0.1ml mercuric chloride), 2x dissolved organic carbon (40ml 0.45 micron filtered, preserved with 0.48ml 20% HCl), 2x headspace (10ml exetainer headspace gas sample), 2x total alkalinity (40ml, 0.22 micron filtered).

Sample 1 (12:18 pm) water parameters: SpCond 338.3 uS/cm, fDOM 35.01 QSU// 11.72 RFU, P 1.371 psi a, Sal 0.16 psu, pH 6.94, T 23.915 deg C, 220mg/L TDS, turb 3.25 FNU

Sample 2 (12:41 pm)water parameters: SpCond 338.3 uS/cm, fDOM 34.48 QSU// 11.54 RFU, P 1.292 psi a, Sal 0.16 psu, pH 6.91, T 24.058 deg C, 220mg/L TDS, turb 3.10 FNU

0 photos found

Graphs display:
8 sets found

Can't check MBWPEESWGT_mixed
Can't check MBEEWPSWEPGT_cam
16 GT_met graphs found

Explore the graph:Temperatures in a new window

Explore the graph:Temperature Profile A in a new window

Explore the graph:Temperature Profile B in a new window

Explore the graph:Temperature Profile C in a new window

Explore the graph:Soil Heat Flux in a new window

Explore the graph:Four channel Radiometer in a new window

Explore the graph:Gilbert Tract PAR in a new window

Explore the graph:PRI Channels in a new window

Explore the graph:NDVI Channels in a new window

Explore the graph:Water level and Rain in a new window

Explore the graph:Dissolved CO2 in a new window

Explore the graph:Air Pressure in a new window

Explore the graph:Battery Voltage and RH in a new window

Explore the graph:SRS NDVI and PRI in a new window

Explore the graph:Conductivity in a new window

Explore the graph:Dissolved Oxygen in a new window

4 GT_flux graphs found

Explore the graph:CO2 and H2O in a new window

Explore the graph:Wind in a new window

Explore the graph:Methane in a new window

Explore the graph:Data Counts in a new window

3 GT_adcp graphs found

Explore the graph:Water Level in a new window

Explore the graph:Flow Velocities in a new window

Explore the graph:Flow Rate in a new window

1 GT_cam graphs found

Explore the graph:GCC in a new window

2 GT_usgs graphs found

Explore the graph:Jersey Island EC, Turbidity in a new window

Explore the graph:Jersey Island Height, Velocity, Discharge in a new window

2 GT_chanexo graphs found

Explore the graph:EXO pH + ORP in a new window

Explore the graph:EXO Turbidity + fDOM in a new window