Field Notes
<--2025-06-27 11:20:00 |Other sites visited today: Bouldin Alfalfa | Rush Ranch | Hill Slough
Phenocam link: Searching...
Bouldin Corn: 2025-07-10 08:15:00 (DOY 191)
Author: Joe Verfaillie
Others: Arman
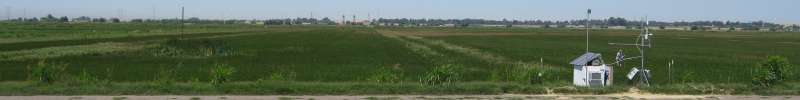
Summary: Corn is super tall and vigorous, soils are moist, remove malfunctioning soil moisture sensor, RSSI low
| Bouldin Corn 2025-07-10 Arman and I arrived at about 9:15 PDT. It was clear sunny and getting hot but a nice breeze for now. There was a crop duster working on Staten doing low turns over the north of Bouldin. The corn is about 2m tall - too tall to measure with a tape. There were a bunch of orb web spiders on the scaffolding. We did the standard data collection. Arman cleaned the sensors, the Arable had more blood on it. I collected the flux, met, camera and z-cam data. The phenocam had a few whole days of corrupted RGB images - IR images seemed fine. The 7500 read: 418.2ppm CO2, 702.7mmol/m3 H2O, 27.5C, 101.2kPa, 103SS The 7700 read: 2.00ppm CH4, 28RSSI - 82.5 after cleaning. The wash reservoir was close to empty. We refilled it and tested the spray and spin all seemed well. There might have been some spider webs blocking the path. No water in the well. I removed the malfunctioning soil moisture probe CS655 sn 17133. The corn has not flowered yet so it was still clean and fresh inside and cooler than in the sun. The ground was moist when I pulled the sensor. I tried to pull a string through the conduit so that I could add a new cable later but the string came loose part way. I saw Charlotte back at Campus and she said they were there just after we left. We left at about 9:45 PDT |
0 photos found
6 sets found
17 BC_met graphs found
5 BC_flux graphs found
Can't check TATWBABCSB_cam
Can't check MBSWEEWPBCBA
No data found for BC_pa.
1 BC_arable graphs found