Field Notes
<--2024-07-22 10:20:00 | 2024-08-15 07:20:00-->Other sites visited today: Hill Slough | Bouldin Corn | Bouldin Alfalfa | East End | Gilbert Tract
Phenocam link: Searching...
Mayberry: 2024-08-07 14:05:00 (DOY 220)
Author: Daphne Szutu
Others: Joe, Kuno
Summary: Biomet Olympics mixed relay sipathon, 7700 calibration, pore water near the tower, BIG spider.
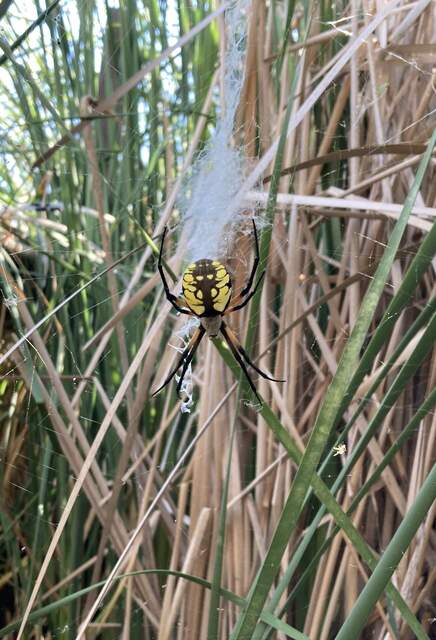
| 2024-08-07 Mayberry Joe, Kuno, and I arrived at 14:05 PST. It was warm and breezy. The staff gauge read 50cm. At Mayberry the fifth event of the 2024 Biomet Olympic hexathalon was held. Here Daphne and Joe competed in the mixed relay sipathon. Joe made a solid start clearing the first ten sippers but his enthusiasm was clearly waning when he passed the conductivity meter to Daphne. Daphne made quick work of the last five sippers and earned some extra style points with her triple-double valve technique. I downloaded met, cam, USB GHG, and miniDOT data. I did not change the miniDOT desiccant because we didn't have any more dry minipaks. The wash reservoir was mostly full and Joe topped it off. There was a large yellow garden spider in the reeds between the boardwalk and the tower. We lowered the eddy post and Kuno cleaned flux and rad sensors. We calibrated the 7700. The offsets were small and we replaced the hat and spray nozzle after the calibration. I checked that the 7700 was connected and that the USB was logging after the calibration. We moved the eddy post back up to its original position after calibration. Joe measured the porewater conductivity for the veg-black and veg-red profiles by the boardwalk. I measured the porewater conductivity for the veg-blue profile. We rinsed the syringe with the initial 10ml of sample and measured the subsequent 20-30ml of sample. Joe cut back some of the reeds that were growing across the boardwalk. The 7500 read: 409ppm CO2, 657mol/m3 H2O, 32.9C, 100.4kPa, 103SS – 105 after cleaning The 7700 read: 2.0ppm CH4, 51RSSI – 86 after cleaning I forgot to write down the 7700 numbers after calibration. Veg-black-green, 6.57 mS, 29.6 C Veg-black-black,,, 10cc rinse then only 10cc more so not enough to measure Veg-black-red,,, none pushed some air and saw bubbles but still none Veg-black-yellow,,, none pushed some air and saw bubbles but still none Veg-red-yellow,, Veg-red-green, 2140 uS, 29.0 C Veg-red-red,, Veg-red-red-red,, Veg-red-white,, Veg-red-black, 4586us,29c Veg-blue-yellow, 8.78 mS, 28.7 C Veg-blue-red,, Veg-blue-white, 9.31 mS, 30.1 C Veg-blue-black,, Veg-blue-green,, Surface, 1291 uS, 26.3 C We left at 15:05 PST. |
1 photos found

20240807MB_GardenSpider.jpg ( 2024-08-07 15:42:45 ) Full size: 1309x1920
Giant garden spider in the cattails
11 sets found
7 MB_flux graphs found
No data found for MB_met.
28 MB_tule graphs found
Can't check MBWPEESWGT_mixed
1 MB_cam graphs found
Can't check MBEEWPSWEPGT_cam
Can't check SIMBTWEE_met
1 MB_minidot graphs found
Can't check MBSWEEWPBCBA
1 MB_processed graphs found
Can't check MB_fd
1 MB_fd graphs found

