Field Notes
<--2024-07-23 09:40:00 | 2024-08-16 07:00:00-->Other sites visited today: Hill Slough | Bouldin Corn | Bouldin Alfalfa | East End | Mayberry
Phenocam link: Searching...
Gilbert Tract: 2024-08-07 15:40:00 (DOY 220)
Author: Daphne Szutu
Others: Joe, Kuno
Summary: Biomet Olympics cross country tank carry, 7700 calibration, All the ADCP data turned into ants, Left some moth balls
| 2024-08-07 Gilbert Tract Joe, Kuno, and I arrived at 15:40 PST. It was breezy and warm. There was more bird poop than I remember on the boardwalk, including plenty of berry-stained poop. It was all on the line for team DKJ at Gilbert Tract in the last event of the 2024 Biomet Olympic hexathalon. Here Kuno and Joe competed in the cross country tank carry. They carried the tanks off the levee, downslope and through the bush. After a long day of events they strained through the uphill climb at the end back to the truck. After strapping the tanks down, Joe stuck the dismount from the truck like a toothpick in a club sandwich. The staff gauge read 36.5cm at 15:51 PST. I downloaded met, cam, USB GHG, miniDOT, and Song Meter Micro data. There was a USB error after I ejected the USB, but the data seemed fine and all seemed well after resetting the 7550. I did not change the miniDOT or SMM desiccant because we didn't have any more dry minipaks. I connected to the SMM via Bluetooth to my phone and was automatically prompted to set its clock and location. Its battery was still at 100%. The wash reservoir was 2/3 full; we refilled it. Joe cleaned out the rain bucket was which full of bird poop. Kuno cleaned flux and rad sensors and we calibrated the 7700. The offsets were small and we replaced the hat and spray nozzle after the calibration. I checked that the 7700 was connected and that the USB was logging after the calibration. Joe measured the surface water conductivity and trimmed back vegetation from our pathway down from the levee road. Sample, temperature-compensated conductivity, temperature Surface, 420.5 uS, 26.7 C The 7500 read: 408ppm CO2, 707mol/m3 H2O, 36.0C, 100.9kPa, 100SS – 100 after cleaning The 7700 read: 2.15ppm CH4, 26RSSI – 86 after cleaning The 7700 calibrated read: 2.09ppm CH4, 85RSSI We went to the channel at 16:20 PST to download the ADCP data. There was something on the road that we jumped out to look at—it was part of a raccoon skull, mostly the nose and top part of its jaw. At the channel, the tide was coming in and the water was clear. The ADCP was in idle mode and there was no data to collect. I guess I didn't restart data collection after all on 2024-07-17. I reset the clock and restarted logging. Joe went back to the truck to get a mothball for the ants in the ADCP box. We left at 16:30 PST. |
3 photos found

gilberttract_IR_2024_08_07_154405.jpg ( 2024-08-08 00:08:34 ) Full size: 1296x960
Joe cleaning something in IR

gilberttract_2024_08_06_104405.jpg ( 2024-08-06 19:07:58 ) Full size: 1296x960
Birds all over the sensors

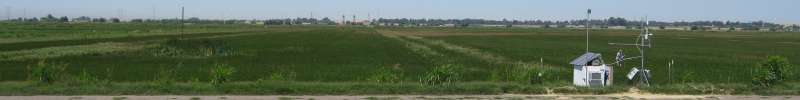
gilberttract_2024_08_07_154405.jpg ( 2024-08-08 00:07:46 ) Full size: 1296x960
Joe working on the tower
8 sets found
Can't check MBWPEESWGT_mixed
Can't check MBEEWPSWEPGT_cam
16 GT_met graphs found
4 GT_flux graphs found
No data found for GT_adcp.
1 GT_cam graphs found
2 GT_usgs graphs found
No data found for GT_chanexo.