Field Notes
<--2025-06-10 12:10:00 | 2025-06-27 15:00:00-->Other sites visited today: Tonzi | Vaira | Bouldin Corn
Phenocam link: Searching...
Gilbert Tract: 2025-06-19 18:00:00 (DOY 170)
Author: Joe Verfaillie
Others: Charlie
Summary: Swapped EXO in Channel for calibration, collected phenocam image I missed last week
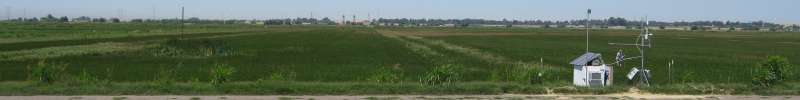
| Gilbert Tract 2025-06-19 Charlie and I arrived at about 19:00 PDT - golden hour. This was a quick stop to swap the EXO at the channel for calibration and to make sure the phenocam was collecting images. We pulled up the water sensor cart and swapped the EXO. These came off: EXO3 sn 23H107001 Wiper sn 24L000786 Turbidity sn 24F102410 fDOM sn 22C100780 pH/ORP sn 24G102326 Cond/Temp sn 24F100050 And these went on: EXO2 sn 22C103416 Wiper sn 24F104086 Turbidity sn 22E106072 fDOM sn 24F104438 pH/ORP sn 22D102641 Cond/Temp sn 23D104030 I added the YSI interface box and connected it to the CR6. At first I didn't think it was working but the CR6 clock was about 8min slow and while I was scratching my head it did a scan and had data from the EXO. I synced the clocks before we left. We made a quick stop at the tower where I swapped the phenocam card. All seemed well, I just missed swapping it on the last visit. There was a leak in the irrigation flooding the path down from the road - I'll notify Katie and Molly. |
0 photos found
8 sets found
Can't check MBWPEESWGT_mixed
Can't check MBEEWPSWEPGT_cam
16 GT_met graphs found
4 GT_flux graphs found
3 GT_adcp graphs found
1 GT_cam graphs found
2 GT_usgs graphs found
2 GT_chanexo graphs found