Field Notes
<--2025-06-19 18:00:00 |Other sites visited today: Hill Slough | Bouldin Corn | East End | Mayberry | Rush Ranch | Bouldin Alfalfa
Phenocam link: Searching...
Gilbert Tract: 2025-06-27 15:00:00 (DOY 178)
Author: Joe Verfaillie
Others: Kyle
Summary: Standard data download - all pretty good, fixed broken wire on Channel miniCH4, Song meter batteries dead, Some bad images (6 days) on the phenocam CF card
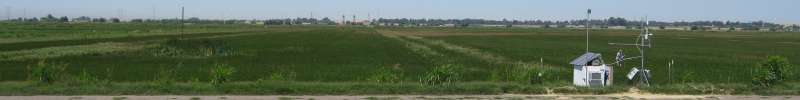
| Gilbert Tract 2025-06-27 Kyle and I arrived at about 16:00 PDT to the channel. It was clear, hot and sunny. The low-low tide was around midday but it was still low and incoming. There was lots of flotsam on the track and over the top of one of the fence posts - super high tides recently. I collected all the Channel data. The CR6 seemed to have full data from the EXO that I swapped last week. The ADCP downloaded okay but I forgot to look at it. I stopped logging before download and restarted logging afterwards. Initially the miniCH4 was not responsive but I found its ground wire had come loose. I unplugged the CR6 while I jammed the miniCH4 ground back in the shared port and then plugged the CR6 back in. After wards I got nearly a full set of data from the MiniCH4, set its start time in the future and restarted timed logging. This box needs an overhaul of its wiring. We did not pull up the cart for the miniDot - it can run for a while longer. We arrived at the tower at about 16:20 PDT. The vegetation has grown up a lot and it is hard to reach the tower and the boardwalk - some trimming is in order. Both Kyle and I got stabbed in an eye by tules at the tower. Kyle did the water measurements on the boardwalk and brought in the two miniDots for data download and desiccant swap. The staff gauge read staff gauge = 28cm at 15:29 PST. Salinity: Surface, 342uS, 23.6C, compensated I started to collect the met, flux and camera data. About six days of images either missing or bad on the phenocam CF card - maybe needs new card. Kyle cleaned the eddy sensors and the radiometers. The 7500 read: 418.2ppm CO2, 667.4mmol/m3 H2O, 33.7C, 100.9kPa, 97.9SS - 99.0 after cleaning The 7700 read: 2.04ppm CO2, 30.0RSSI - very noisy, did not get after cleaning value Kyle refilled the wash reservoir The batteries in the Song Meter were dead, but it had mostly a full set of sound files. There was not enough room to move the files onto the SneakerNet lap top so I moved them unto the new laptop. I put new lithium batteries in the Song Meter and its status was okay - although it seems to report less free space on the card than I expected - I think the card should be almost empty but it said about a third full. We left at about 16:50 PDT |
0 photos found
8 sets found
Can't check MBWPEESWGT_mixed
Can't check MBEEWPSWEPGT_cam
16 GT_met graphs found
4 GT_flux graphs found
3 GT_adcp graphs found
1 GT_cam graphs found
2 GT_usgs graphs found
2 GT_chanexo graphs found